KSE-100’s Remarkable Journey: From 40,000 to 180,000 in Four Years
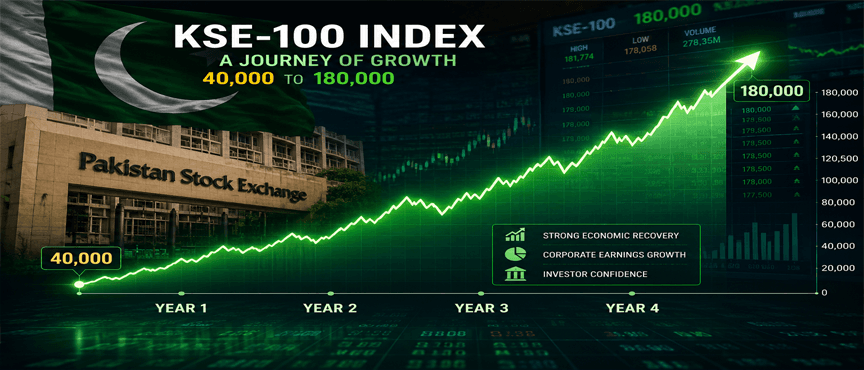
KSE-100’s Remarkable Journey: From 40,000 to 180,000 in Four Years
Few markets have rewarded patient capital like the Pakistan Stock Exchange. Four years ago, the KSE-100 Index was languishing near the 40,000 level. Today, the benchmark PSX 100 index has touched the 180,000 mark—a move of roughly 350% that has reshaped how local investors, young traders, and overseas Pakistanis view Pakistan equities.
But this KSE-100 rally is not just a number on a screen. It is the result of a rare convergence of macroeconomic stabilization, policy reform, corporate earnings resilience, and a structural shift in domestic savings. Below, we break down the KSE-100 historical performance, the factors behind the KSE-100 growth, and the future outlook for Pakistan equities.
The Starting Point: KSE-100 at 40,000
Four years ago, Pakistan’s equity market was facing a deep crisis of confidence. Macroeconomic imbalances, currency weakness, elevated inflation, and political uncertainty kept the KSE-100 Index range-bound. Foreign investors were net sellers, local mutual funds remained cautious, and many retail investors had exited the Pakistan stock market altogether.
At 40,000, the market was pricing in significant pessimism. Valuations were compressed, dividend yields were elevated, and many fundamentally strong companies were trading below book value. In hindsight, that period marked a generational low for the Pakistan Stock Exchange.
The Four-Year Surge by Numbers
From 40,000 to 180,000, the KSE-100 Index delivered one of the strongest four-year performances in PSX history.
Key highlights of the KSE-100 four-year performance include:
- Index level: approximately 40,000 to 180,000
- Cumulative gain: roughly 350%
- Market capitalization: expanded sharply in rupee terms
- Leading sectors: energy, banks, fertilizers, cement, technology, and pharmaceuticals
- Participation: significant rise in retail and institutional inflows
For context, this KSE-100 historic rise far outpaced inflation, fixed-income returns, and most property market benchmarks in major cities. It restored the reputation of PSX as a legitimate wealth-building asset class for long-term investors.
Why Did the KSE-100 Rise from 40,000 to 180,000?
The KSE-100 journey from 40k to 180k was not driven by a single event. It was a multi-year re-rating supported by several structural and cyclical factors.
1. Macroeconomic Stabilization
A critical turning point was the restoration of macroeconomic discipline. Improved current account management, tighter fiscal policy, and external financing support reduced sovereign default risk. As sovereign risk declined, the equity risk premium compressed, leading to multiple expansion across the KSE-100 Index.
2. Currency Stability and Investor Confidence
Currency volatility had historically eroded dollar returns for foreign investors and weakened local confidence. A period of relative rupee stability gave investors the confidence to value future earnings more predictably. When currency expectations stabilised, money that had moved into dollars and real estate began returning to PSX.
3. Corporate Earnings Recovery
Pakistan’s listed companies proved remarkably resilient. Banks benefited from high interest margins, energy companies from improved cash flows, fertilizers from strong demand, and exporters from steady remittances. The KSE-100 performance was underpinned by tangible earnings growth, not just multiple expansion.
4. Valuation Re-rating
At 40,000, the KSE-100 was trading at a fraction of regional and historical valuations. As risk perceptions improved, the market moved from deeply discounted levels toward fair value—and then beyond. This repricing was the single largest contributor to the early phase of the KSE-100 rally.
5. Domestic Liquidity and Retail Participation
One of the defining features of this KSE-100 growth was the surge in local participation. New brokerage accounts opened at record pace, mutual funds saw sustained inflows, and digital trading platforms made PSX accessible to young investors and first-time investors. This structural demand created a floor under Pakistan equities.
6. Policy Reforms and Market Infrastructure
Improvements in trading technology, faster account opening, better investor protection, and PSX’s engagement with retail investors all helped. Analysts and financial educators, including voices like Abdul Rahman Najam of Sarmaya and Nukta Pakistan, have consistently argued that financial literacy and accessible market commentary played a meaningful role in broadening the investor base.
7. Real Estate and Fixed-Income Rotation
With real yields in fixed income declining and real estate transaction costs high, equities became the most attractive asset class for Pakistani savers. The shift from real estate and gold speculation into productive equity ownership was a powerful tailwind behind the KSE-100 index growth in four years.
Phases of the KSE-100 Rally
Understanding the KSE-100 historical performance requires breaking the move into distinct phases.
Phase 1: The Re-Rating Phase — 40,000 to 70,000
The initial leg was driven by valuation normalization. Blue-chip stocks with strong dividends led the recovery. The market moved from existential fear to cautious optimism.
Phase 2: The Earnings and Liquidity Phase — 70,000 to 120,000
As macroeconomic stability became more entrenched, earnings momentum accelerated. Local institutions, high-net-worth individuals, and mutual funds increased equity allocations. The KSE-100 record high kept resetting, drawing in momentum-focused traders.
Phase 3: The FOMO and Structural Inflows Phase — 120,000 to 180,000
The final phase was marked by broader retail participation, new fund launches, and increasing confidence among overseas Pakistanis. Sentiment shifted from “why invest in PSX?” to “why not invest in PSX?”. While this phase included sharp corrections, the overall trajectory remained firmly upward.
What the KSE-100’s Rise Means for Investors
For long-term investors, the KSE-100 journey from 40,000 to 180,000 offers several lessons.
First, market bottoms are impossible to time, but valuation extremes are often visible. Second, staying invested through volatility matters more than trying to trade every swing. Third, equity ownership remains one of the most effective ways to compound wealth in Pakistan despite periodic political and economic shocks.
However, a four-year rally of this magnitude also raises the bar for future returns. New investors should avoid assuming the next four years will mirror the last. Position sizing, diversification, and a focus on earnings quality are now more important than ever.
Risks to Watch After 180,000
No market moves in a straight line. The KSE-100 record high at 180,000 brings its own risks:
- Valuation froth in low-quality names
- Resurgence of inflation or current account pressure
- Political or policy uncertainty
- External shocks and commodity price volatility
- Global interest rate environment and foreign portfolio flows
A disciplined approach—favouring companies with strong cash flows, low debt, and sustainable dividends—can help investors navigate the next phase of the Pakistan stock market.
Future Outlook for the KSE-100 Index
The structural tailwinds behind Pakistan equities remain intact: a young population, rising financial inclusion, improving digital access to PSX, and a growing culture of equity investing. If macroeconomic discipline continues and corporate earnings compound, the KSE-100 index’s long-term trajectory could remain positive.
That said, the easy re-rating gains are likely behind us. Future KSE-100 performance will depend more on earnings delivery, productivity gains, and continued local savings mobilization. As market commentary from platforms like Sarmaya, Nukta, and analysts including Abdul Rahman Najam often emphasizes, investors should focus on process—valuations, earnings quality, and asset allocation—rather than index levels alone.
FAQ
1. What drove the KSE-100 Index from 40,000 to 180,000 in four years?
The rally was driven by macroeconomic stabilization, currency stability, strong corporate earnings, valuation re-rating, rising domestic liquidity, and a structural shift in Pakistani savings toward equities.
2. Is the KSE-100 still a good investment after reaching 180,000?
It can be, but investors should be more selective. The easy re-rating phase is over, so future returns will depend more on earnings growth, sector fundamentals, and disciplined portfolio construction.
3. How can retail investors participate in the Pakistan stock market?
Retail investors can open brokerage accounts with PSX-licensed brokers, invest through mutual funds or exchange-traded funds, and use digital platforms to buy KSE-100 stocks. Long-term, diversified investing tends to work better than short-term trading.