Market Analysis and Trade Insights: Sector Rotation, Key Levels, and Risk Management for Q2 2026
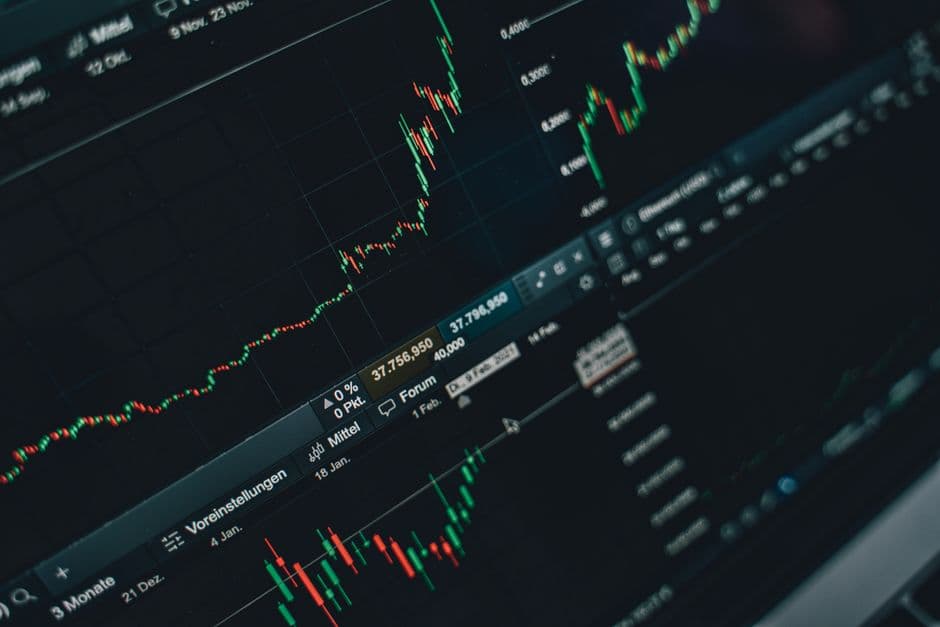
The first half of 2026 has delivered a masterclass in market nuance. After a strong start to the year, investors now confront a tug-of-war between resilient corporate earnings and persistently sticky core inflation. As an analyst at MRA Securities, I focus not on predicting every tick, but on identifying high-probability setups, respecting key technical levels, and managing risk across asset classes. Below is a comprehensive market analysis and trade insights framework for the current quarter.
Macro Dashboard: Growth, Inflation, and Policy
The macro backdrop remains mixed, which explains much of the recent sideways price action in equities.
- Economic growth: U.S. GDP is tracking around 2.0–2.2% for Q2 2026, supported by AI-related capital expenditure, manufacturing reshoring, and resilient consumer spending on services.
- Inflation: Headline CPI has cooled to approximately 3.1% year-over-year, but core CPI remains stickier at 3.5%–3.6%. Shelter and insurance costs are the main culprits.
- Monetary policy: The Federal Reserve has held the federal funds rate at 4.25%–4.50% for several meetings. Futures markets are pricing in only one 25-basis-point cut by December, down from two cuts expected at the start of the year.
- Labor market: Nonfarm payrolls are growing at a moderate pace, with the unemployment rate at 4.1%. Average hourly earnings growth of 3.7% year-over-year is not alarmingly high, but it keeps services inflation elevated.
Globally, the eurozone is flirting with stagnation as manufacturing PMI hovers near 49.5, while China’s targeted stimulus has stabilized industrial output but has not reignited a broad recovery. These crosscurrents suggest that U.S. equities remain the primary destination for global capital, but sector selection is critical.
Equity Market Technicals: Levels That Matter
As of early May 2026, the S&P 500 is consolidating after a sharp April rebound. The index rallied roughly 6% from its April low before encountering resistance near the 5,900 level.
Key technical observations:
- Support: The S&P 500 has strong support between 5,640 and 5,680, which aligns with the 100-day moving average and a previous breakout zone. A daily close below 5,600 would signal a deeper pullback toward 5,400.
- Resistance: The immediate resistance band sits at 5,900–5,950. A decisive close above 5,950 would open the door to a retest of the all-time high near 6,100.
- Momentum: The 14-day Relative Strength Index (RSI) on the S&P 500 is near 58, indicating positive but not overbought conditions. The Nasdaq 100 is slightly more extended with an RSI of 63, reflecting stronger megacap tech leadership.
- Breadth: Market breadth has improved, with 62% of S&P 500 constituents trading above their 200-day moving average. However, small-cap equities continue to lag large caps, suggesting the rally is not yet fully broad-based.
For traders, these levels provide a clear risk map. Buying near support with a stop below 5,580 offers a favorable risk/reward profile, while chasing breakouts above 5,950 without volume confirmation increases drawdown risk.
Sector and Style Analysis: Where the Smart Money Is Rotating
Sector leadership has shifted meaningfully over the past eight weeks. The AI infrastructure theme remains dominant, but we are seeing early signs of rotation into overlooked cyclical areas.
Current leaders:
- Communication services and technology: These sectors continue to benefit from robust cloud demand, digital advertising growth, and AI monetization. Earnings revisions remain positive, and institutional flows are concentrated here.
- Energy: Crude oil has stabilized between $72 and $78 per barrel WTI. Energy companies are generating substantial free cash flow, and capital expenditure in oilfield services is rising for the first time in three years.
Current laggards:
- Utilities and consumer staples: Defensive dividend payers have underperformed as real yields remain elevated. Investors are unwilling to pay premium multiples for bond proxies when cash yields over 4%.
- Small caps: The Russell 2000 remains below its 2024 highs, pressured by higher borrowing costs and tighter lending standards.
Style rotation insight: Value outperformed growth in the first quarter as investors favored lower valuations. However, since April, growth has reasserted dominance as AI earnings continue to surprise to the upside. The market is rewarding companies with strong pricing power and visible earnings growth, regardless of style label.
Trade Insights: Three High-Conviction Setups
The following trade ideas are designed for a multi-week horizon and incorporate disciplined entry, stop, and target levels. These are not recommendations for every portfolio but examples of how to apply the current market analysis.
1. Pullback in High-Quality Technology
The technology sector remains the strongest earnings grower, but it is prone to sharp, short-term pullbacks when bond yields spike.
- Setup: Wait for a pullback toward the 50-day exponential moving average on a broad technology ETF or a basket of megacap tech names.
- Entry zone: Near the 50-day EMA, roughly 3–5% below current prices.
- Stop-loss: Below the most recent higher low, approximately 3% below entry.
- Target: A retest of the prior high, offering a risk/reward ratio of approximately 2:1.
- Rationale: AI capital expenditure guidance remains strong, and earnings visibility is superior to most other sectors. A pullback driven by temporary rate anxiety often provides an attractive re-entry point.
2. Breakout in Oilfield Services
Energy services companies are benefiting from a multi-year underinvestment cycle that is now reversing.
- Setup: Look for a breakout above a well-defined resistance level formed over the past three months.
- Entry zone: On a daily close above resistance, or a retest of the breakout level.
- Stop-loss: Below the breakout level or the 20-day moving average, whichever is lower.
- Target: A measured move equal to the height of the consolidation range, typically 10–15% upside.
- Rationale: Rising upstream capital spending, stable oil prices, and strong free cash flow generation support the fundamental case. Energy services stocks tend to outperform in the middle phase of a capital expenditure cycle.
3. Pair Trade: Long Cyclicals vs. Short Defensives
This is a relative value trade that isolates sector rotation while reducing overall market beta.
- Setup: Long an equal-weight industrials or materials ETF, while short an equal amount of a utilities or consumer staples ETF.
- Entry zone: When the ratio of cyclicals to defensives breaks above its 50-day moving average.
- Stop-loss: If the ratio falls back below the 50-day moving average.
- Target: A move to the upper Bollinger Band on the ratio chart, or a 5–8% gain in the spread.
- Rationale: If economic growth remains positive and bond yields stay elevated, cyclicals with pricing power should continue to outperform defensives. This trade is less dependent on overall market direction.
Risk Management: The Non-Negotiable Component
No market analysis is complete without a clear risk framework. The most common mistake traders make is concentrating risk in highly correlated positions during a period of low volatility.
- Position sizing: Risk no more than 1–2% of portfolio capital on any single trade idea.
- Correlation check: If you are long technology, energy services, and cyclicals simultaneously, understand that all three are beta-positive. A sharp risk-off event will likely hit all of them at once. Use offsetting hedges or reduce total exposure.
- Event calendar: Be aware of CPI releases, FOMC meetings, and major earnings dates. Avoid initiating large directional positions immediately before high-impact events unless you are explicitly trading volatility.
- Stop-loss discipline: Base stops on technical levels and average true range, not arbitrary percentages. A stop that is too tight will get shaken out by normal noise; a stop that is too wide defeats the purpose of risk control.
Conclusion
The current market environment rewards patience, selectivity, and technical discipline. The macro backdrop is not uniformly bullish or bearish, but it provides clear signposts. As long as the S&P 500 holds above 5,600 and breadth continues to improve, the path of least resistance remains higher for quality cyclicals and AI-driven growth. However, the compression in rate-cut expectations means that valuation risk is real, and investors should avoid paying premium prices for defensives with no earnings growth.
By focusing on support and resistance levels, sector rotation, and well-defined trade setups, investors can navigate Q2 2026 with a professional edge. The goal is not to predict every market move, but to participate in the highest-probability trends while protecting capital when the signals fail.
---
FAQ
1. What is the most important data point for market direction right now?
Core CPI is the single most important data point. If core inflation stalls above 3.5%, the Federal Reserve is unlikely to cut rates in 2026, which pressures equity valuations, especially in long-duration growth stocks. Conversely, a sustained drop in core services inflation would support a broader rally.
2. Is it better to buy the dip now or wait for more clarity?
With the S&P 500 holding above its 100-day moving average and breadth improving, selective dip buying in sectors with strong earnings momentum is reasonable. However, avoid deploying all capital at once. A staggered approach — buying one-third at current levels, one-third on a successful retest of support, and one-third on a confirmed breakout — reduces timing risk.
3. How can individual traders apply these insights without taking excessive risk?
Use broad sector ETFs rather than single stocks to reduce idiosyncratic risk. Limit each position to 1–2% of total portfolio value, always place a stop-loss based on technical levels, and avoid trading high-impact economic event days. A disciplined, multi-week horizon is far more effective than trying to day trade macro news.
---
Featured Image Prompt: A professional stock market trading floor at dusk, multiple monitors displaying candlestick charts, sector heatmaps, and macroeconomic indicators; dark blue and teal tones with orange data overlays; high-resolution financial analysis photography style.